
Operational Data Platform for Physician Productivity and Compensation
Healthcare data lake service · Case study
A data architecture approach to consolidating operational inputs, applying transparent calculation rules and supporting explainable reporting
- Organization
- Healthcare organization
- Engagement
- Architecture assessment and solution design
The engagement at a glance
This case study describes architecture work for a healthcare organization seeking to support a productivity-based physician compensation model. The source materials document existing-state and proposed architecture diagrams, alongside business requirements for calculation and reporting. They support a description of the design approach, but do not establish that the proposed platform was deployed or operated in production.
The operational problem
Compensation decisions depended on activity and pay information spread across operational, scheduling, billing and financial systems, with rules and timing differences that needed consistent treatment.
The architecture response
Separate data acquisition and raw-data staging from downstream preparation, calculation logic and analytical reporting; favor a SQL-oriented processing design for prepared data.
Evidence boundary
The available artifacts document architecture recommendations and business requirements. They do not verify a production implementation, automated payroll, or measured business outcomes.
The proposed architecture
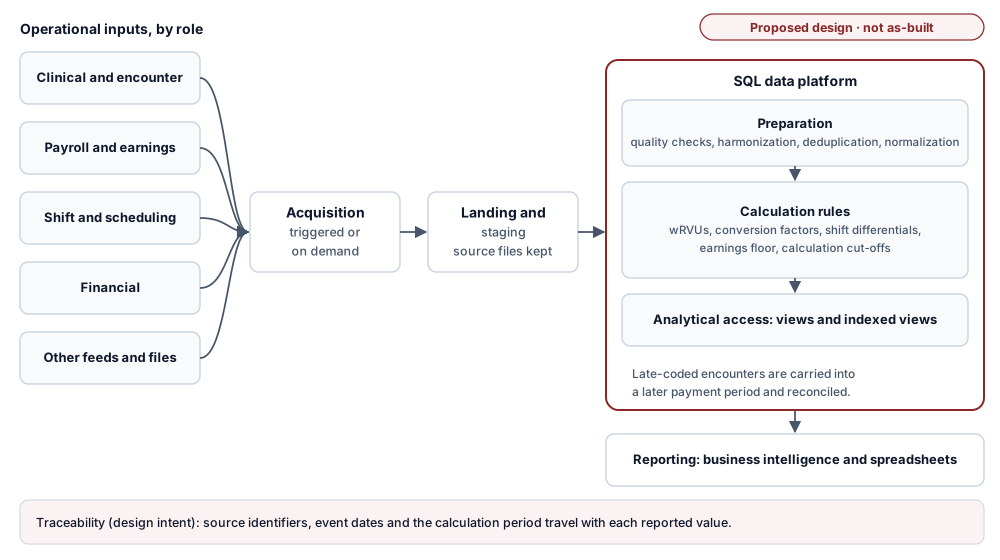
Operational inputs by role (clinical and encounter, payroll and earnings, shift and scheduling, financial, and other feeds and files) are acquired by triggered or on-demand data-integration workflows and land in cloud object storage, where source files and staged data are retained. A SQL data platform then prepares the data (quality checks, harmonization, deduplication, normalization), applies the calculation rules (wRVUs, conversion factors, shift differentials, the earnings floor and calculation cut-offs, with late-coded encounters carried into a later payment period), and exposes views and indexed views. Business intelligence and spreadsheet reports read those views for calculation review. Source identifiers, event dates and the calculation period are carried through so a reported value can be traced to its source records.
The business and data challenge
The compensation model was intended to connect physician productivity with compensation in a more consistent and explainable way. To support this, the organization needed to combine operational activity, provider attribution, shift information and historical pay components, then apply a set of agreed rules to calculate productivity-based earnings and produce a report that providers and administrators could review.
- Fragmented inputs: the source diagrams show several categories of source applications, including clinical/encounter systems, payroll and earnings systems, scheduling/shift administration, financial systems and other operational feeds or files.
- Policy-driven calculations: the requirements describe rules for attributing work relative to chart completion and billing identifiers, calculating work relative value units (wRVUs), applying conversion factors and shift differentials, and comparing productivity earnings with an earnings floor.
- Historical data and configuration: site-level rates and historical earnings codes were needed to model conversion factors. The requirements also called for reference information that distinguished pay components included in the model from those that should be excluded.
- Timing and reconciliation: an encounter could not be included in a productivity calculation until it had been coded. If coding occurred after the relevant calculation cut-off, the activity could be included in a later payment period. The materials also considered whether attribution should follow date of service or claim date.
- Explainability: a compensation report needed to connect source activity and calculation inputs to the resulting earnings components, so that calculations could be reviewed rather than presented as an unexplained total.
Why late-coded encounters matter
Clinical activity, coding, billing and payroll do not necessarily occur at the same time. A physician may complete an encounter in one period, while the encounter is coded or billed only later. A calculation based only on records available at an earlier cut-off can therefore omit activity that becomes eligible afterward. The working-session material describes carrying late-coded encounters into a subsequent productivity payment period and also raises claim-date attribution as an alternative to date-of-service attribution.
From a data-design perspective, this makes event dates, processing cut-offs, coding status and payment-period rules important. A robust implementation would need to preserve the dates used for attribution, identify which calculation period included each item, and support reconciliation when late-arriving records change a prior period's view. These are design implications of the documented requirements, not a claim that such controls were implemented.
Architecture approach
The supplied diagrams show an evolution from a data flow with acquisition, a data lake, a separate post-processing layer and a working data warehouse toward a proposed integrated design that keeps acquisition and staging distinct while moving more transformation into the SQL data platform.
- Source acquisition Acquire data from operational roles such as clinical/encounter, payroll/earnings, scheduling, financial and other system or file feeds. The proposed diagram identifies triggered or on-demand acquisition and shows Azure Data Factory and Azure Logic Apps in that role.
- Raw-data landing and staging Use cloud object storage as a reservoir for source files and staged data. This layer provides a place to retain source inputs and manage preprocessing before they are transformed for downstream use. The architecture identifies Azure Data Lake Storage for this purpose.
- Data quality and preparation Prepare data for use through cleansing, validation, harmonization, deduplication, transformation and normalization. These functions are shown in the proposed architecture as responsibilities of the data-processing layer.
- SQL-oriented transformation The proposed design recommends moving transformation and analytical preparation into the SQL data platform, using database queries and structures such as views and indexed views, rather than maintaining a separate U-SQL-based post-processing layer for all processing. The diagram also references materialized views in its explanatory notes.
- Business rules and analytical access Apply the required business logic and make prepared structures available for downstream analysis. The architecture shows a business-logic application and SQL-based analytical structures; the detailed allocation of calculation rules between database objects and application code is not fully specified in the supplied artifacts.
- Reporting and review Power BI and Microsoft Excel are shown as reporting consumers. The proposed diagram describes direct access to prepared analytical structures and notes that direct access to selected source files, XML or databases may also be possible for specific analytical needs.
Logical data flow
- Operational inputs Clinical and encounter data • payroll and earnings • shift and scheduling data • financial data • other system feeds and files
- Acquisition Triggered or on-demand ingestion through managed data-integration workflows
- Landing and staging Retain source files and staged data in cloud storage; keep acquisition separate from downstream transformations
- Preparation and calculation Quality checks, harmonization, deduplication, transformation, normalization and business-rule processing
- Analytical data access SQL-based prepared structures such as views or indexed views, subject to validated platform design
- Reporting Business intelligence and spreadsheet-based reporting for calculation review and operational analysis
This is a generalized representation of the proposed design, not a verified as-built architecture.
SQL-oriented processing recommendation
The existing-state diagram described Azure Data Factory for ETL, Azure Data Lake for source-file storage, Azure Data Lake Analytics using U-SQL for post-processing, and Azure SQL Database for the enterprise data warehouse. Its notes also considered Azure Databricks and Azure SQL Data Warehouse as alternatives. The later proposed architecture changed the processing recommendation: keep source acquisition and file storage, but move more cleansing, validation, transformation and analytical preparation into the SQL platform, with views or indexed views serving reporting.
The intended architectural benefit was to simplify the processing path and make changes to analytical structures easier to manage. The source notes suggest reduced ETL maintenance as a rationale, but they do not provide measured evidence that maintenance effort was reduced. The appropriate implementation choice would depend on data volumes, transformation complexity, refresh needs, concurrency, operational constraints and the capabilities of the selected SQL service; these factors are not resolved by the supplied diagrams.
Traceability and reporting design
The PBC requirements imply a need for reports that explain how activity becomes a compensation result. The working-session presentation describes reporting on provider activity and the resulting calculation, while the architecture positions Power BI and Excel as downstream consumers. For a production design, this would typically require the report to expose or reference the activity period, attribution date, coding or claim status, applicable conversion factor, shift differential, earnings-floor adjustment and the calculation period. The exact report layout and final data fields were still described as being in progress or are not fully established in the supplied material.
- Preserve source identifiers and relevant event dates so calculated values can be traced back to source records.
- Make the rule/configuration values used for a calculation identifiable, including site-level rates and eligible earnings-code classifications.
- Distinguish the earnings-floor component from productivity-based earnings and any applicable shift differential.
- Handle late-arriving or late-coded activity through a defined cut-off and reconciliation process.
- Provide reviewable calculation details instead of only a final aggregate amount.
The bullets above describe traceability needs implied by the requirements and recommended design; they are not assertions that each control was delivered.
Documented artifacts
- An existing architecture diagram describing source systems, acquisition, Azure Data Lake Storage, post-processing, a working data warehouse and reporting consumers.
- An existing architecture diagram with recommendations, recording observations about processing components and alternative platform choices.
- A proposed integrated architecture diagram showing generalized source inputs, acquisition, a data reservoir, SQL-oriented processing and reporting.
- A working-session presentation describing the productivity-based compensation model, calculation variables, examples, reporting expectations, pilot approach and unresolved policy questions.
What the evidence supports — and what it does not
Supported by the supplied records
- Assessment and diagrams of an existing data flow and a proposed alternative.
- Recommendations for cloud-based acquisition, source-file staging, SQL-oriented transformation and BI access.
- Business requirements for compensation calculation, timing, reporting and a planned manual pilot.
- Identification of design concerns such as late-coded encounters, historical pay inputs and calculation transparency.
Not established by the supplied records
- Production deployment or operation of the proposed architecture.
- Completed integration of every source category or implementation of all calculation rules.
- Automated payroll processing or confirmed successful launch of the pilot.
- Measured savings, accuracy improvements, performance results or quantified operational benefits.
Relevance to healthcare data initiatives
This work illustrates an architecture approach to turning fragmented operational information into a more consistent analytical foundation: identify the source roles, retain raw inputs, prepare data with explicit quality steps, apply business rules in a maintainable processing layer, and provide reporting that can be reviewed against the underlying activity.
For a similar initiative, a practical first phase would validate source access and data ownership, map the business calculation rules, profile data quality and latency, agree reconciliation and reporting needs, and select a target processing pattern based on actual workload characteristics. The output should be a validated architecture and delivery roadmap with explicit acceptance criteria before implementation claims are made.
Confidentiality and scope note
This public-facing version intentionally omits the customer's name, individual names, specific pilot locations, internal project labels, exact working-session dates, original screenshots and client-specific identifiers. Source systems are described by business role where possible. It is based on historical architecture diagrams and business-requirement materials. It describes recommendations and requirements rather than verified production implementation. No customer endorsement, deployment status, operational responsibility, performance metric or financial outcome is claimed.